Quality Management
Top 7 Basic Quality tools fir your Career!
Last Updated: Jan 2025
Modern global challenges make organizations follow an organized scientific approach to face the challenges and invest in active human potential to achieve the requested goals with more efficiency and effectiveness, the huge development of the century, made organizations use a lot of statistical, and managerial.
Other tools to succeed in their work and out of these tools there are quality tools where that help the organization in controlling quality assurance and developing and improving the performance, here the referee is the customer and that is through his perspective of quality, achievement of his expectations and the extent of satisfaction about the product or the service.
To achieve total quality at work there are seven quality tools used in organizations where we provide a lot of information to resolve the problems of organizations and extract the desired solutions.
The Seven Quality Tools:
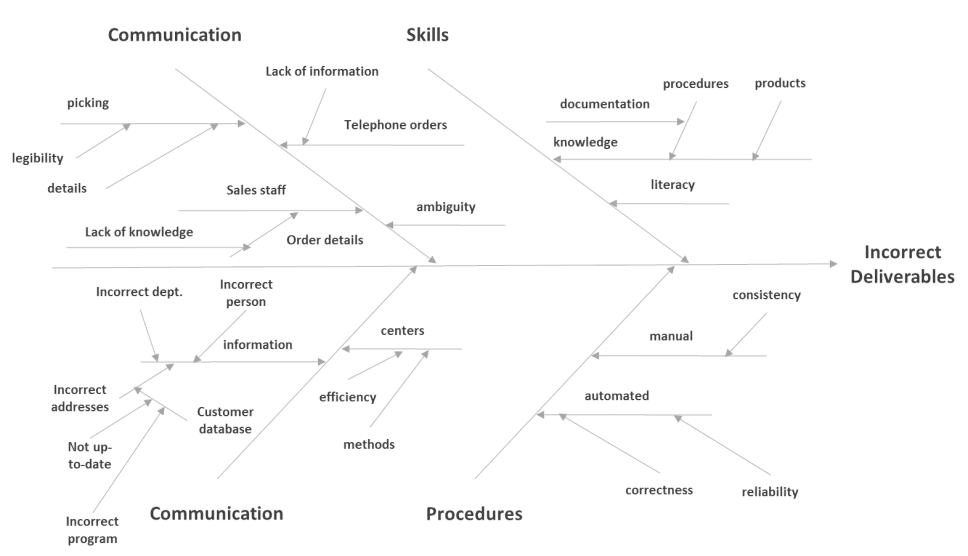
1. Cause-and-effect diagram (Ishikawa diagram):
This Basic Quality tool was named after a Japanese scientist called Kaoru Ishikawa who developed this technique in 1943, it is also called the fishbone diagram (because the shape of the diagram looks like a fishbone), this diagram connects the effective causes and the results in a shape of a fish bone where the skeleton represents all the potential impacting factors.
The head represents the result or the impact which means the relationship between the results of a process and the effective factors in this process, it is noticed that every process is affected by an infinite number of items.
So we should focus on the effective items, which, it is used to determine the potential reasons behind the problem or the requested goals, and then focus on these reasons to develop the appropriate solutions and provide suggestions that may improve the production or recruitment process, and it can be used to organize a brainstorming session and it directly sorts the ideas into useful categories.
It is an organized and easy diagram for reading and it also increases practical knowledge and identifies the areas of data collection.
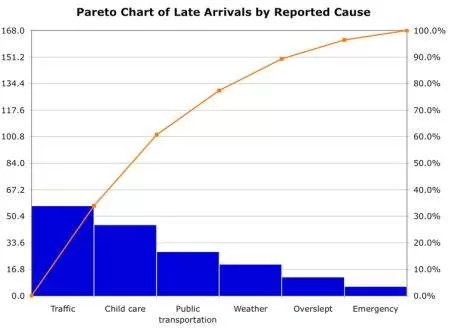
2. Pareto chart:
it is a creative way to look at the reasons for the problems, and it helps to stimulate thinking and organizing ideas. But it becomes restricted in case of excluding problems which may be important but seem to be minor in the beginning however, through time become more important because through this chart problems can be arranged in a descending order from most frequent to least.
According to their importance and their recurrence. Through the Pareto map, the team working on the quality can determine the most important and effective problems and therefore focus on resolving them.
This analysis depends on the Pareto principle which is symbolized by the 80/20 law, through this technique the quality team can determine the most important and effective reasons in the process which symbolizes 20% of the reasons and therefore we can get rid of 80% of the practical problems.
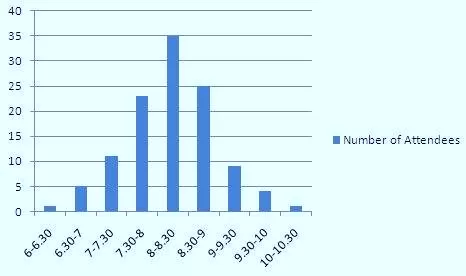
3. Histogram:
the most commonly used graph for showing frequency distributions, or how often each different value in a set of data occurs. Therefore, we can classify the collected data into many categories and in the calculations of frequency, through it we can extract important information about the product or service quality such as the average value of the data (main).
The number of differences in the data, its dispersion, judgment on the output quality, and the performance of the process comparing it with specific qualities from the client side can be also used to understand a complicated process, to find the connection and the relationship between the events and to get a brief idea about the difficult route in the process and the events that involve the difficult route.
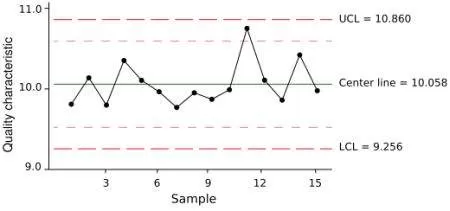
4. Control Chart:
It is the best tool for monitoring the performance of a process. Whereas through it we can make a statistical analysis of the changes in the process; to control and monitor the quality of a product or a service and improve the performance of the process.
It is a graph used to study how a process changes over time, and through it, we can distinguish between the natural changes that refer to the general inherent reasons in the process and changes which refer to specific reasons.
Through it, we can determine whether the process is under statistical control or is beyond the statistical observation as it works under other factors that affect the quality of the product or service provided.
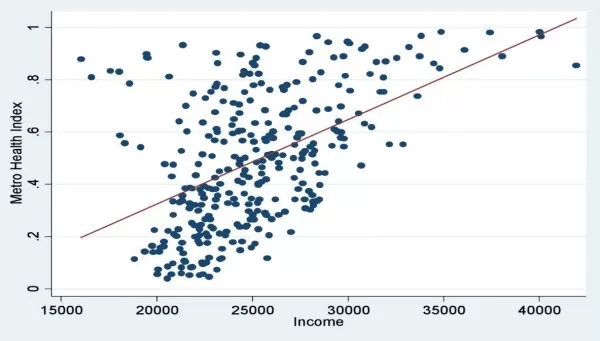
5. Scatter Diagram:
It is a scatter diagram that analyzes the data of the processes where we can search for a potential relation between two variables, and it is also considered one of the tools that improve the quality of the process improvement teams.
One of the most important uses for this diagram in the field of quality, research, and detection of cause and effect between two variables, and clarifying the type of the relationship between the two variables, also knowing how powerful their link is.
It is used in designing and documenting the process or the simple programs, and it helps in imaging what is happening, understanding the process in a better way and finding the possible defects.
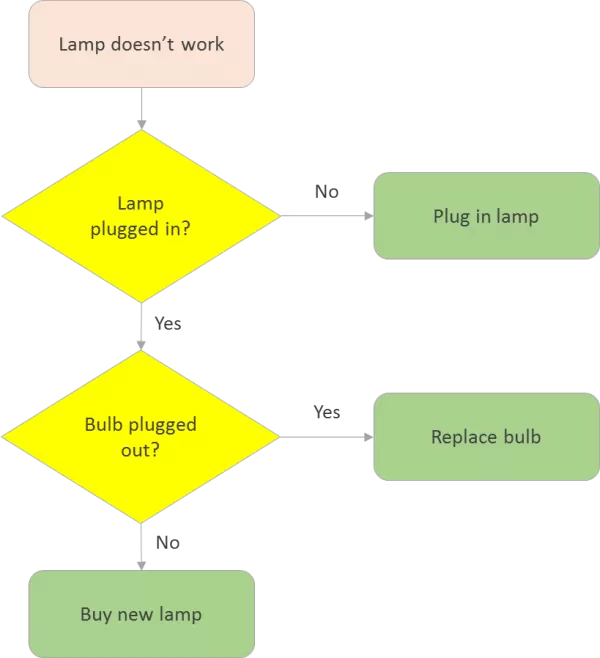
6. Flow Chart:
It is a chart that describes the flow of the process and the steps and procedure that a product or a service experiences, this chart is used to describe the current processes and their sequence.
Actually, this is what allows for explaining the main required processes and proposing adjustments and improvements through the production and service-related processes.
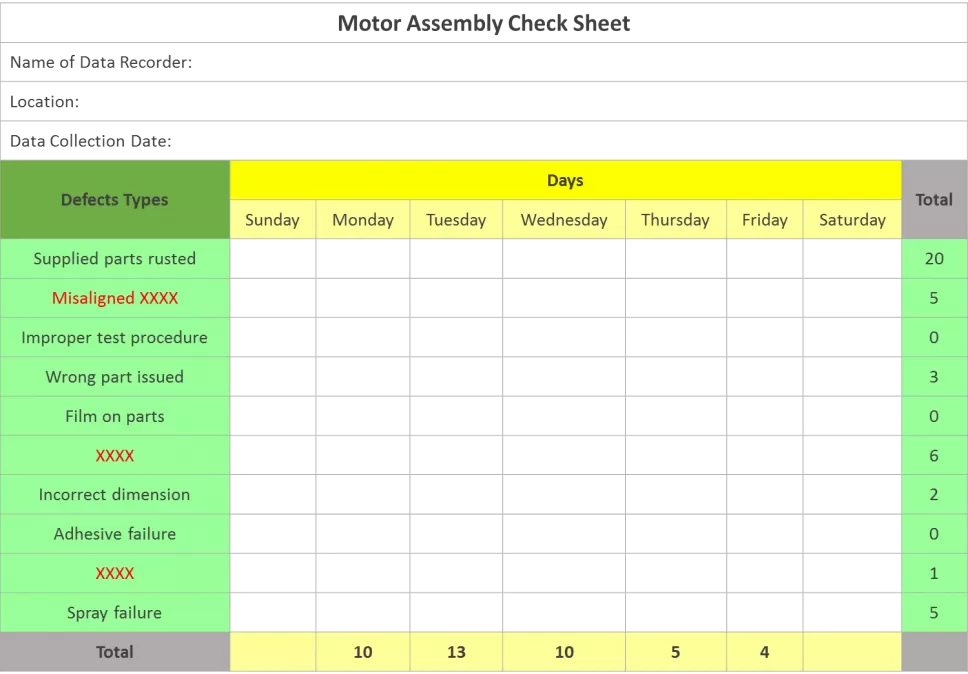
7. Check sheet:
It is a technique used to collect, classify and record quantitative and qualitative data with similar characteristics in an organized manner, and through collecting and organizing the data, teams that are responsible for improving the process can analyze the data easily; which helps in identifying the problems in the process and making the appropriate improvements.
The aforementioned seven basic quality tools help in addressing different concerns in an organization. Therefore, the use of such tools should be a basic practice in the organization in order to enhance efficiency. Training on these tools should be included in the organizational orientation program, so all the staff members get to learn these basic tools.
Quality Management Courses:
There are several quality management courses and certificates for better management. Here are the Quality management courses provided by Bakkah:
- ISO 9001 Foundation - QMS Course
- Lean Six Sigma Yellow Belt Course
- ISO 9001 Introduction - QMS Course
- ISO 22301 Introduction - BCMS Course
- ISO 45001 Introduction- OHSMS
- ISO 14001 Introduction - EMS
Bakkah Inc. for training and consulting is considered as a pioneer in providing training in this field.
Bakkah team for training and consulting
Contact us to get special services and quality tools consultations from our professional team!
Related Courses
Our learning programs are delivered through a tested and professionally designed methodology.